Results Timelines
- Jonathan Schmale
Starting with version 11.4.2.5, Elector now supports the display of Results Timeline charts.The data is generated by the Election Results simulator and the Consortium parser by recording each update as it happens.
Charts
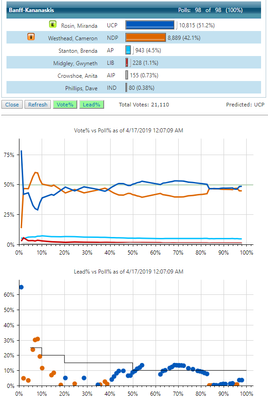
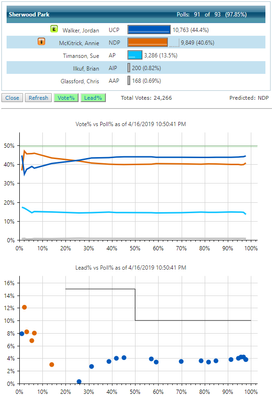
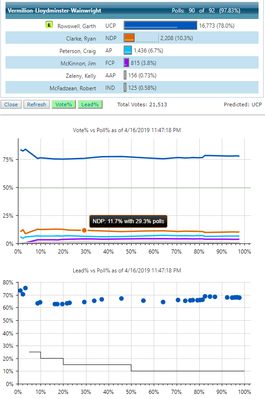
Riding Results
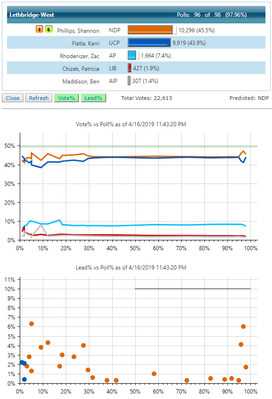
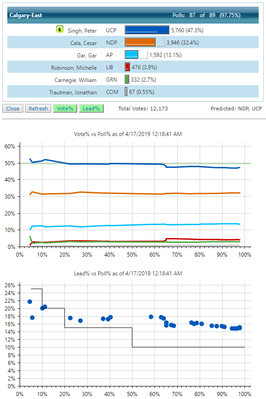
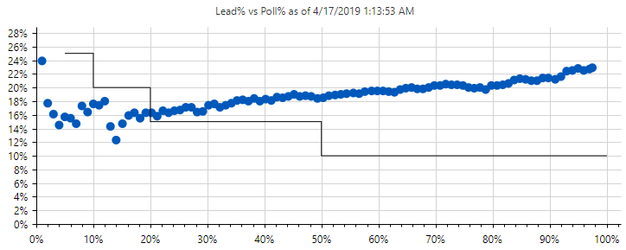
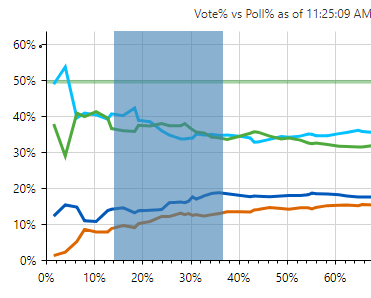
There are 2 charts designed to display at the riding level. Both charts use the same timeline data: Vote Percent vs Poll Percent and Lead Percent vs Poll Percent. The black lines on the Lead Percent chart indicate thresholds that may indicate the riding should be considered for declaring the candidate elected when the lead party has gone above it.
Related Preferences
The guideline for an electable riding is now configurable via this preference: Prediction: Electable Lead-Poll Percent Steps. This guideline is visualized in your Lead% chart as a black line.
Where Do I See the Charts
These results charts are available in
- Riding Results Summary - results popup
- Riding Detail - results tab
- Export as images via the BLADE module
They only display when timeline data is available.
Chart Samples
Flip Flop
This type of result is rare.
Leader Change
Dominant Party
Close Race
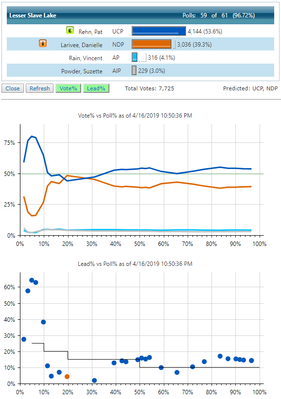
Very Tight Race
This is a tough one to call.
Linear Results
These are the most common results.
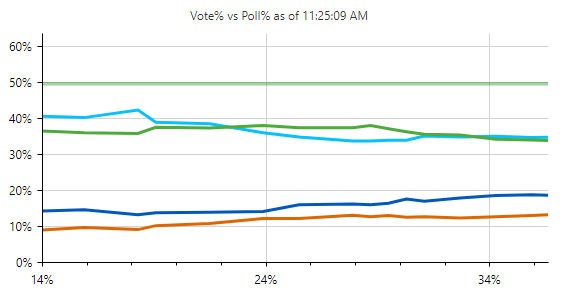
Overall Party Results
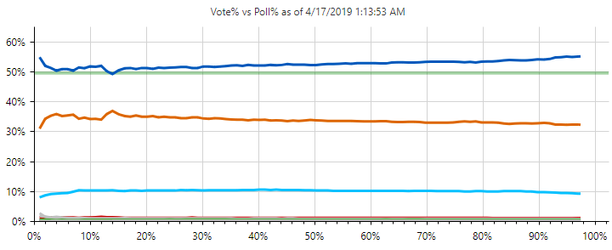
There are 2 charts designed to display at the party level. Both charts aggregate the same riding timeline data: Vote Percent vs Poll Percent and Lead Percent vs Poll Percent.
These are available in the Race Overview module. They only display when timeline data is available.
Samples
The following samples display a result where the winning party moved ahead fairly early on and maintained that lead throughout.
Zooming
The charts have built in an option to zoom in on a selected section of the chart and then pan/slide the chart left/right.
To zoom you press the shift key and then drag to highlight a section of the chart. When you stop dragging and release the chart will display the highlighted section. Then you can pan left to right to see the other portions of the chart. To reset to the whole chart – refresh the chart/page and the chart will load normally again.
Below you can see an example of the selection of a section of the chart.
Below is the result of zooming on the above selection.